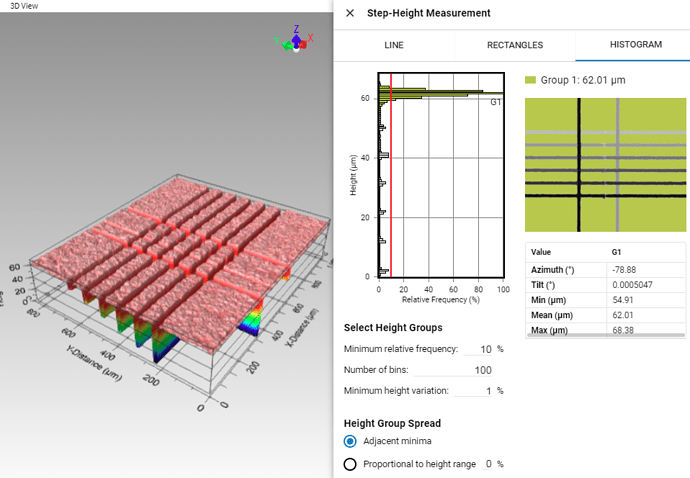
I saved one of the public gallery images to my images to play around with the different step height methods. I could measure the heights with the ‘Line’ mode, but I can’t seem to get the ‘Histogram’ mode to work. What am I doing wrong, it only shows one height at 62 µm?
Hi wrance,
I love that image!
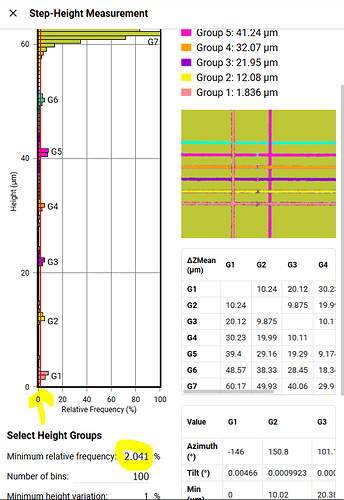
The way to make the histogram work on a sample like this, is to adjust the ‘minimum relative frequency’. It acts as a threshold to determine what counts as a step and what does not. By default it is set to 10%, which in this case only makes the top surface qualify as a step surface. The cuts are too small and don’t constitute 10% of the image surface.
You can adjust the minimum relative frequency two ways: 1. enter a number in the highlighted area, 2. drag the vertical red line in the bar graph.
You can tell whether a surface is included by the color. It also gets assigned a G number. You can view the average heights of each G surface in the top right table. The bottom right table can be used to look up differential steps. Let’s say I want to know the height difference between surface G2 and G3: row G2 and column G3 (or vice versa) gives me 9.875 um.
Hope this helps!
-Menno
Great, that helps quite a bit. Thanks for the detailed explanation!
Menno’s suggestion is correct, and definitely the first thing to try with Histogram measurements. Adjusting the “Number of bins” and the “Minimum height variation” can also help. i.e. increasing the number of bins will typically sharpen the Histogram peaks making them taller.

