I scanned the surface of a paint film before and after aging with a Profilm 3D. Now I would like to compare them. Unfortunately, the scan length was not the same for both measurements. I was able to achieve a similarity by manually adjusting the Color Scale and setting the Z axis ‘Origin at center’. However, I would be interested to know how this zero point is set, as it obviously does not take the center of the scan length and seems surprisingly almost exactly the same for both measurements?
And are there other ways of editing measurements with different scan lengths so that they can be compared?
Even without understanding details about your before and after measurement, it seems you may have a couple of issues to worry about. First the before and after scans may be offset slightly in the x, y direction and may even have a slight difference in rotation angle. Second, the scans may have an offset in z – which is what you specifically been asking about.
I know of no features built in to ProfilmOnline to do this type of difference analysis. However, if you are a Filmetrics P3D customer and you have access to the Profilm desktop software, it has a feature to “Subtract images” and deals with x, y offsets and even differences in pixel size, tilt, rotation angle, and z-offset.
If you only have access to ProfilmOnline, your best bet is to download each image in “Filmetrics Text” format and read into an offline tool such as Matlab, Python, or even Excel. You will then be able to account for all of the above with your own analysis (which may be quite involved).
Thank you again for your valuable help. In fact, I am mainly interested in comparing the z axis of the two scans. I have made my scans with a Profilm 3D and have access to the software, but so far I have mainly used Profilmonline for processing and analysis. I would also be interested to know if there is no absolute zero point of the z axis stored in the metadata or is it only defined via the scan length of a scan?
I found the following information in the manual:
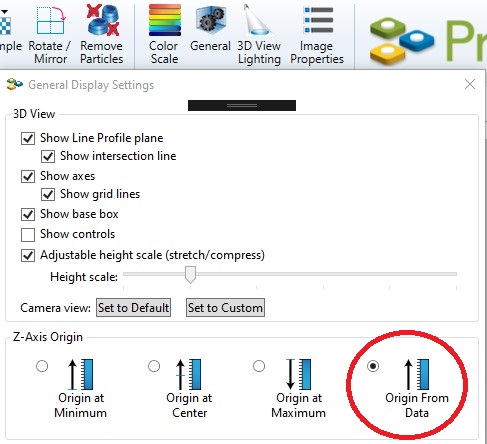
Z-Axis Origin: From Data - Range is set based upon absolute position in the scan range.
Still curious to know how this is determined, as it seems to be set quite randomly in my scans.
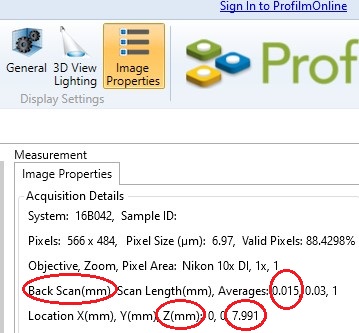
To form an “absolute” z-height, you need to combine three items: The z-height of the image (with Z-Axis Origin set to “From Data”, the “Backscan” and the "Location “Z” from image properties (see screen captures below). The “Location Z” in image properties corresponds to the initial z-motor coordinate when the Start button is clicked prior to the scan. Before making the scan, the z-stage is first lowered by the “Backscan” amount specified in the recipe. Then the voltage to the piezos is ramped to do the scan. So, the zero “From Data” corresponds to the height of the scan before the voltage is scanned.
To convert the height to an absolute scale, you need to add locationZ - Backscan to the height.
Unfortunately, these three elements are found in the Profilm Desktop software but the Z-Location is not displayed in ImageProperties of ProfilmOnline.
There are some other issues you need to be aware of. The P3D has a manual tip-tilt stage and depending on the tilt of the sample and the precise orientation of the tip-tilt stage, the sample surface – even when placed at the same location on the stage – can end up at different physical heights. If the sample is placed at a different location on the stage, it will also end up at a different height. So to compare samples on the same scale, you will need to make sure to place the sample at a consistent location on the stage and try not to disturb the tip-tilt stage. This may prove difficult.
I recommend investigating whether there might be a way to preserve a region on the sample that will always have the same height in both the “before” and “after” scans (mask it off prior to applying the paint? or scratching off the paint in a small zone prior to aging?). If the paint isn’t too thick, you could then use that region in both scans to know the difference between them just by looking at the images. If the paint is too thick, you could still use the bottom of the scratch to set the initial z-height prior to the scan to a consistent location.
Thank you again for your detailed answer. It is incredibly valuable for me and hopefully for other users as well. Determining an absolute point over the Z location can be challenging. I have conducted repeated scans with identical settings after 24 hours and found deviations of approximately 50µm in height. This difference is significant for a scan length of around 300µm. Of course the substrate of my samples, a hardboard, may have changed slightly or I may not have hit exactly the same spot on the stage. Therefore, I need to correct the zero point as I cannot use ‘from data’ to have the same reference despite identical Z location and scan length. This step may also be necessary if you have an absolute reference in the sample. Regrettably, I could not find a way to manually set the zero point in an existing scan in the P3D software. I believe I must compare the data one-to-one in another software to correct the deviation.